Experiment with conditional bus-priority at controlled intersections
in Eindhoven
In the city of Eindhoven (the Netherlands), all vehicles of the public
transport company (Hermes) have an on board computer that computes the
punctuality deviations constantly (even while between stops) and requests
priority at controlled intersections only when it determines that the
vehicle is late. This system of conditional priority reduces punctuality
deviations a lot, as can be seen by comparing the graphs below.
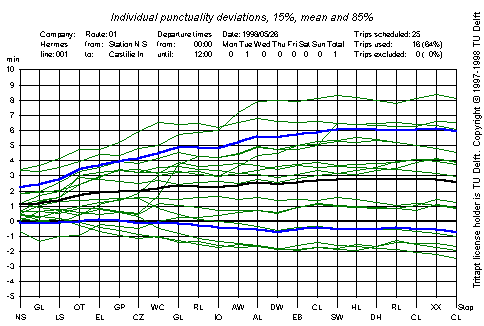
- The first graph was produced on a day that the on board computers
did not have a valid timetable, thus no priority was requested by the on
board computers.
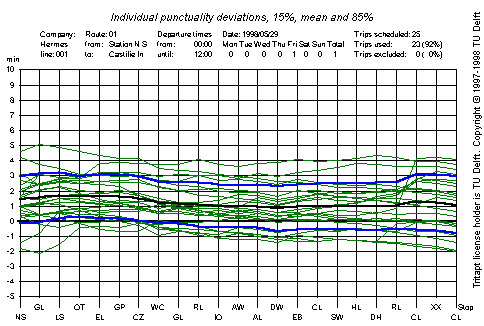
- For the second graph the on-board computers used a timetable that
was created from observations made with absolute priority for the buses
at all controlled intersections. This timetable was computed using
TRITAPT.
The schedule was the same for both graphs.
In the graphs below, the fine green lines indicate punctuality deviations of
individual vehicles. The bold blue lines are the 15% and 85% values,
while the bold black line indicates the mean punctuality deviation.
The stops are shown along the horizontal axis, the punctuality deviations
along the vertical axis. If a bus is exactly on time along the whole route,
there should be a green horizontal line at level 0. If a bus is late, the
green line is above 0, if a bus is early below 0.

Punctuality deviations with no priority. In this case the buses
got no special treatment at controlled intersections.

Punctuality deviations with conditional priority. The buses were
given priority only when the on-board computer indicated that the the
bus was late. If an on-board computer (for any reason) did not have
the correct timetable loaded, no priority was given.
The first graph clearly indicates that punctuality deviations vary
widely, though the majority of vehicles was late. Drivers could not do
much to correct that situation.
The second case (which is the normal state of affairs in Eindhoven) shows
what can be achieved with conditional priority. The lines spread out
only slightly because getting early with respect to the timetable is
almost impossible during the first half of the route (there are no
controlled intersections on the second half of the route). Evidently,
there were a few trips that started more than 4 minutes late, or more
than one minute early. These buses were apparently "adjusted" by the
conditional priority system.

