Also, if conditional priority is applied at controlled intersections (priority only for late buses), delay can occur if the bus is early. If so, that delay should also be classified as control time.
TRITAPT tries to identify control time from the vehicle log files. However, slight errors are unavoidable.
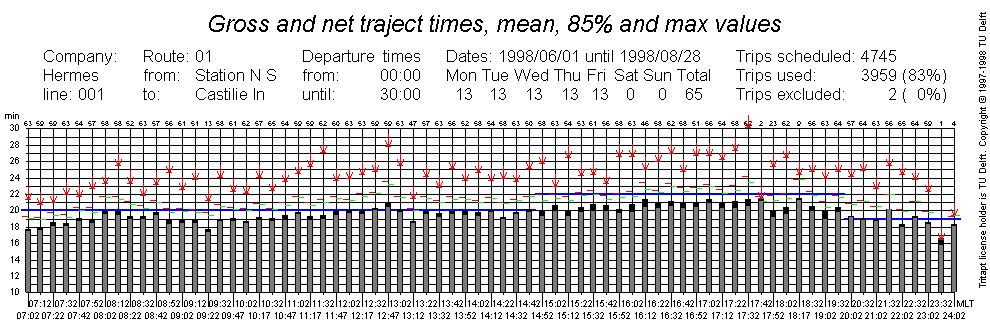
Gross route section time is the time that elapsed between departure of
a vehicle from the first stop of the route section and arrival at the
last stop.
Net route section time is gross route section time minus control
time.
The graph below shows how TRITAPT displays gross and net route section
times.
Along the horizontal axis, the scheduled departure times are indicated. Along the vertical axis, the observed and scheduled route section times are shown.
The bars in this chart consist of a black outer shell and a gray inner
filling. The top of the black shell indicates the 50% gross route section time,
the top of the gray filling indicates the 50% net route section time.
Above each bar there are small red and green horizontal lines. These
indicate the 85% gross (red) and net (green) route section times.
The red arrow indicates the longest observed gross route section time.
The bold horizontal blue line indicates the scheduled route section time.
This graph can be used to identify trips with exceptionally long route section times. (There is a tabular format of this data that enables identification of the actual trip.) Such trips can easily be removed from analysis. In this case shown only two trips have been excluded in this way. There are probably a few more candidates, such as the trip that took about 28 minutes starting at 12:47.
If the timetable is correct, the fine horizontal green lines should be close to the horizontal blue line. The steps in the bold blue line between the trips starting at 14:42 and 14:52 and between the trips starting at 19:32 and 20:02 indicate boundaries between homogeneous periods. From this graph it appears that the 2nd homogeneous period should probably start a few hours earlier, around 11:30.