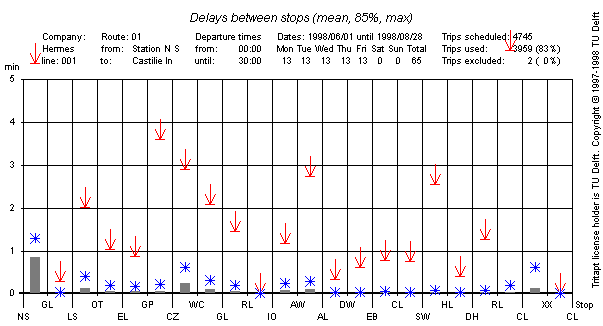
The horizontal axis in the graph shows two-letter abbreviations for the stops along the route. The vertical axis shows observed delays in minutes. The exact location between two successive stops is not shown; because that information is not stored in the database files.
A gray bar between each pair of stops indicates the average delay that
occurred. A blue asterisk indicates the 85% value (thus 85% of the
trips encountered no more than that amount of delay). The red arrow
indicates the highest value that was observed.

The graph show delays between stops on line 1, route 1, which goes from the main railway station to a quiet suburb (Achtste Barrier). From the graph it is clear that most delay occurs between the first two stops, on average about 50 seconds. This is more that the combined delay on the rest of the entire route. The reason for this delay is that at the first controlled intersection of the route, the buses get no special treatment. The municipality believes that bus priority at this intersection would hamper other traffic too much. The delay between the first two stops causes a rather low operational speed between those stops.
One other exceptionally long delay (almost 6 minutes) occurred once between
the second stop marked RL and the second stop marked CL. The explanation
for this event is that on some trips the bus is empty when it gets here and
some drivers take a rest here, instead of at the terminal stop. This
example shows that these graphs should do not always tell the whole truth.
Intimate knowledge of the route is required to distinguish real trouble
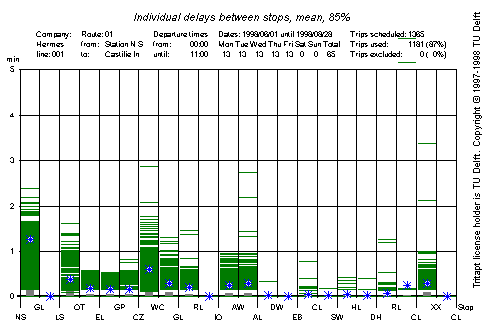
spots from fake ones. TRITAPT can also produce a graph where all delays
are shown, see the graph below.

Individual delays are indicated with small horizontal green lines. Because this graph is based on 1181 observed trips, many of the green lines are so near one another that big green blobs occur. Nevertheless, one can get an impression of the probability distribution of the delays. The reason that delays between one and six seconds do not occurr, lies in the method used by the on-board computers to detect and record delays. The use on board computer does not record delays shorter than about six seconds.