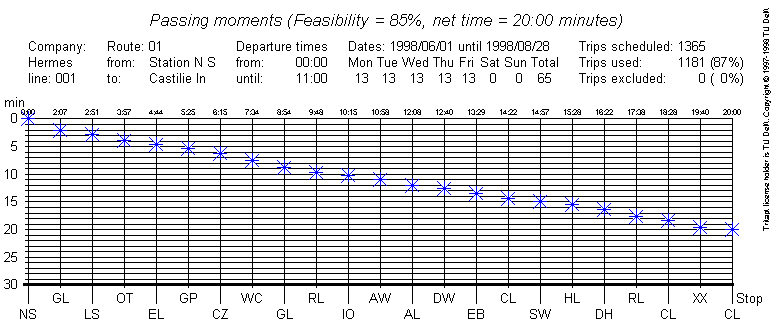
The horizontal axis of the graph is marked with two-letter abbreviations
for the stops along the route. The vertical axis shows the time between
the start of the trip and the passing moment at the halt. The way
that passing moments are computed yields times from each halt to the
end of the route, in this graphs, these have been converted to times
from the beginning of the route.

TRITAPT can produce passing moments graphs for a reasonable set of
integer trip times, and for certain values of the feasibility.
In this particular graph, the route section time was set to 20 minutes.
The (rounded) value of the feasibility is 85%. A feasibility of 85%
would result in a trip time of 19 minutes and 59 seconds.
When the passing moments are converted to a published schedule, the times should preferably be rounded down. If the vehicles have on-board computers that constantly compare the scheduled with the current position of the vehicle, the highest precision supported by the on-board computers should be used for the timetable on those computers.