Partition in homogeneous periods
The first stage in the design of optimal
timetables is partition in homogeneous periods.
Driving times along a public transport route are not constant during the
day and also vary between different types of days of the week. If the
schedule does not take these variations into account, some trips will
have insufficient times allotted, while other may have too much. Both
cases are bad.
- Too much time is bad, because some drivers will deliberately
depart late from the initial stop so that they can drive at their
"preferred speed" rather than trying to drive slow. Other drivers will
simply depart on time and soon get ahead of schedule several minutes.
The combined effect is that the punctuality deviations at all stops
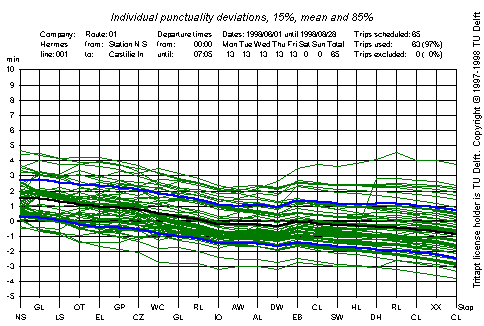
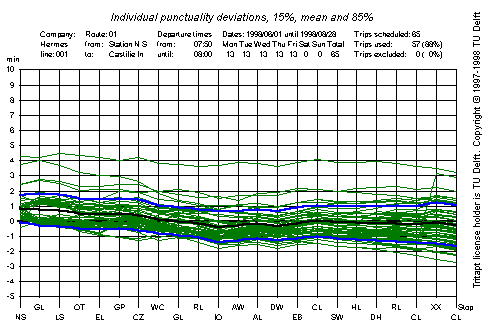
along the route are high. Please compare the two graphs below:

Punctuality deviations for the first scheduled trip of the day. This
trip can generally be completed in 19 minutes, while the scheduled time
is 20 minutes.

Punctuality deviations for the sixth scheduled trip of the day. The
scheduled time for this trip is very near the 85% needed time.
There may be some additional effects influencing the punctuality of the
first scheduled trip, that exaggerate the effect.
- Too little time is bad. Some drivers will deliberately depart early
from the initial stop in order to complete the trip on time. Other
drivers will simply depart on time and try to keep up with the schedule
(and usually fail to do so). Again the combined effect is that the
punctuality deviations along all stops along the route are high.
Large punctuality deviations result in large waiting times for the
passengers. It has been observed that at low frequency operation
passengers arrive at such a time that the probability of missing the
intended vehicle is between 2% and 3%.
Thus these passengers arrive at the stop about 2 times the standard
deviation before the mean observed vehicle departure time. Thus a
standard deviation at a stop of 3 minutes results in a mean waiting
time for the passengers of about 6 minutes. For short trips this can
significantly alter the average speed of the trip for the passenger.
The TRITAPT program proposes
homogeneous periods based on observed route section times. In order for this
operation to be statistically reliable, many trips must have been
recognized. In the graph below, the average is about 60 trips, except
for the last two scheduled trips of the day. (These are often not
recognized, because most drivers terminate the trip as soon as the
last passenger has alighted.)

The horizontal axis is marked with the scheduled departure times (of
the "old" schedule). the vertical axis shows route section times.
The gray bars indicate the observed mean net
route section time, the red arrow the highest observed net route
section time. The plain horizontal line (which has two steps) indicates
the "old" scheduled route section time. The blue boxes indicate the
suggested homogeneous periods and the suggested route section time for
each period. The blue asterisks indicate the 85% net route section times.
The blue boxes roughly follow the asterisks. There is a limit to the
deviation between a blue box and an asterisk. In this graph this tolerance
was 90 seconds. The program leaves some of the pattern recognition to the
human user. For instance, between 13:22 and 16:02, there are two blue
boxes to choose from. From this graph, it appears that the trip scheduled
for 13:12 scored rather low on 85% route section time. A good partition
(based on this graph) would be:
- Until 11:00: 20 minutes
- From 11:00 until 20:00: 22 minutes
- After 20:00: 20 minutes (the program does not even show this value as
a suggestion)
- For the trips after 23:30 there is insufficient data to computer what
constitutes a feasible route section time. Therefore some extrapolation
is applied.
Usually, some playing around with the tolerance value gives a good idea
as to which period boundaries might be used. From this example it is
clear that some human judgement is required.
After a partition in homogeneous periods is decided on,
passing moments must be computed for each
stop and each homogeneous period.


