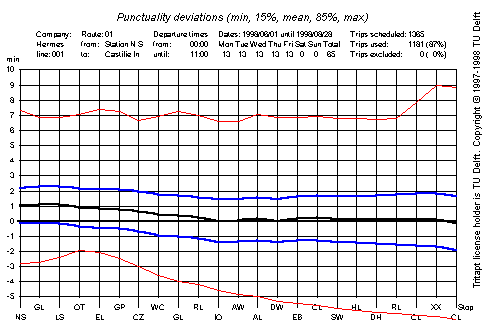
The horizontal axis in the graph is labeled with two-letter abbreviations of the halts. The vertical axis shows punctuality deviation in minutes. A positive punctuality deviation means that a vehicle is late, a negative value indicates that a vehicle is early.
The red fine lines indicate the earliest and latest vehicle
observed. The bold black line shows the mean punctuality deviation.
The bold blue lines indicate the 15% and 85% values.

In this graph one can observe that at the initial stop, the vehicles depart, on average, one minute 10 seconds late. The vehicles catch up with the timetable in the first 10 stops and then stay at that level for the remainder of the route. On this route, a system with conditional priority at controlled intersections is used. This means that the buses get priority only when late with respect to the timetable.
The bold black line in this graph is remarkably flat. This is
because the timetable used on this line has been improved
several iterations using homogeneous
periods and passing moments
computed with the TRITAPT program. Before this improvement, the
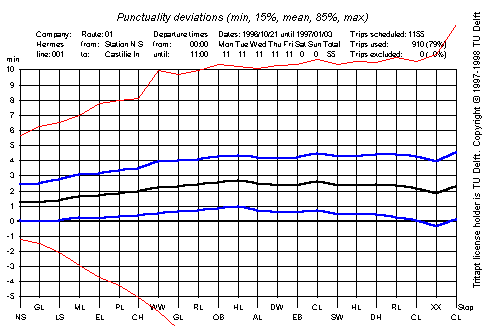
graph looked more like this.

In this graph, there is clearly insufficient time on the first half of the route and almost enough time on the second half. Less than 15% of the vehicles arrive at the terminal on time, most are more than 2 minutes late.
In both the first and the second graph, remarkably few vehicles depart early from the initial stop. This is probably caused in part by the departure control system that is in use at this stop.
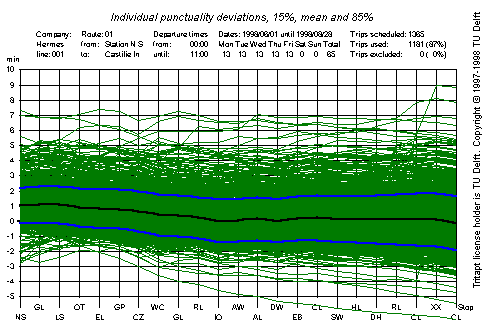
TRITAPT can also produce a similar graph in which the punctuality
deviations of all observed vehicles are displayed. Every vehicle
is represented by a fine green line.

Because 1181 trips are plotted, it is not possible to distinguish individual lines, except the more exceptional punctuality deviations. Comparing the first and third graphs (which were made from exactly the same set of observed trips) shows that the red lines in the first graph connect the extreme punctuality deviations of several different trips.
TRITAPT can also show this information in tabular form. In this table it is easily possible to locate the earliest or latest vehicle at any particular stop. Thus it is straightforward to locate the trip that was the earliest observed one from halt EL until the end of the route. TRITAPT will identify the date, time and vehicle that made this trip. With that information it should be easy to confront the driver and have him/her explain why (s)he was more than 5 minutes early for most of the route.
By itself A system such as TRITAPT can not by itself improve operational quality in public transport. Drivers, planners and management of the company and municipality traffic authorities must all be involved and convinced of the need to produce a high-quality public transport service.