TRITAPT - TRIp Time Analysis in Public Transport
By Theo H.J. Muller and Peter Knoppers
TRITAPT is a software package for analyzing public transport performance.
TRITAPT provides:
- Quality indicators (speed, punctuality)
- Operational characteristics (running times, delay)
- Timetable optimization information (route times, feasibility, and
passing moments)
- Passenger load information
- Quality comparisons between lines, routes, different days of the week,
different months, quarters or years, and transit companies
Recognized trips are stored in a custom file
format. Each database file contains information of all the trips of
a route during one day. A route is a path of a public transport line
in one direction between one initial stop and one terminal stop.
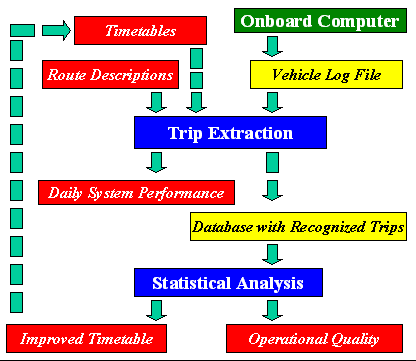
The software operates in two stages.
The first stage generates the database files. It imports schedules and
extracts trips from vehicle log files
(produced by on board computers, or an AVL system) and stores them in
the database files. Stage one is usually run daily (unattended).
Stage two analyses the recognized trips and
generates many graphs and tables that may help to locate and quantify
problems. It also performs several analyses to support in the development
of optimized timetables. This stage is run
only as required by the user.
The information flow is depicted below.

The analysis program TRITAPT runs under Windows XP, Vista, or Windows 7.
One day, one route analysis
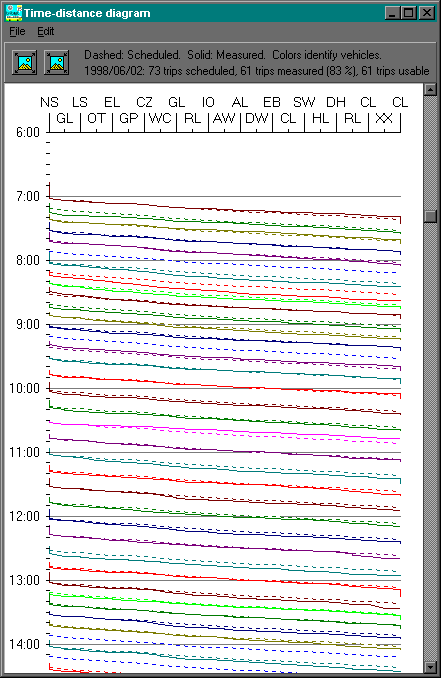
The program (usually referred to as TRITAPT), can display time/distance
trajectories for any single day and route.

The horizontal axis shows (two letter abbreviations for) the stops of
the route. The vertical axis shows the time. If a vehicle was used for
several trips, the same color re-appears. The dashed lines show the
scheduled trips, the solid lines the observed trips. From this graph one
can clearly observe the amount of time that some vehicles were stationary
at the initial and terminal stop of the route.
Some observations that can be made from this graph are:
- Most vehicles started their trip within one or two minutes of the
scheduled departure time.
- The vehicle that started around 08:13 was late on arrival at the first
stop and unable to catch up.
- The vehicle that started around 10:31 got ahead of schedule and the driver
apparently did not try to compensate. The fact that the preceding trip was
slightly late may have contributed to this.
Multiple day analysis
For statistical analysis, TRITAPT allows selection of trip data of
multiple trips by:
- company
- line
- route (unique path in one direction between initial and terminal
stop)
- route section
- date
- time
and provides the following types of graphs and tables:
Most of these graphs can be produced in an "aggregated" way, or in a
"trip by trip" way. The aggregated way shows average, 15%, 85% percentile,
minimum and maximum observed valued, while the trip by trip way shows the
values for each observed trip as separately. The latter form is useful for
identifying exceptional trips that should not be used as a base for a
sound timetable. (See Eindhoven priority
experiment for some examples of trip by trip graphs.)
In addition the graphical displays, most information can also be produced
in tabular form.
Introducing TRITAPT in your transit operations
To introduce TRITAPT conversion software must be developed to convert
planning data and AVL or vehicle computer data into TRITAPT files. It is
normal that during this phase various problems in the available data are
discovered. Therefore the introduction is usually carried out in the
following steps:
- Planning data and observed data for one or two lines/patterns and one
date is extracted from the company database. Import functions ara
adapted to convert that data into a TRITAPT base file.
- The number of dates and the number of lines/patterns is increased in
a few steps. Conversion of this data is automated by setting up a service
at the TU Delft which automatically converts supplied data into a set of
TRITAPT files that are emailed back to the company.
- Eventually the data conversion is moved to an in-house computer.
Somewhere around step 2 a license for TRITAPT is negotiated.
Data required by TRITAPT
TRITAPT needs a route description, scheduled arrival
and departure times for all stops and all trips and information about
each observed stop event and delays that occurred
between stops. If information about delays between stops
is unavailable some functionality in TRITAPT is unavailable.
Contact information
For more information concerning the TRITAPT system, please contact
Peter Knoppers
Email: P.Knoppers@tudelft.nl
Phone: +31 15 278 2762
Fax: +31 15 278 3179
Or write to
Peter Knoppers
Delft University of Technology
Faculty of Civil Engineering
Transport
& Planning
P.O. Box 5048
2600 GA Delft
the
Netherlands


